In the spirit of Women’s History Month, it’s time to spotlight Florence Nightingale, a remarkable woman whose impact transcends generations.
While many know Florence Nightingale as the caring nurse who tended to wounded soldiers during the Crimean War, Nightingale also contributed to the innovative use of data visualization. This blog post discusses how the famous nurse Florence Nightingale used charts to demonstrate her life-saving work to her target audience.
Did you know that Data Visualization has origins in military healthcare reforms?
Going Down Memory Lane…
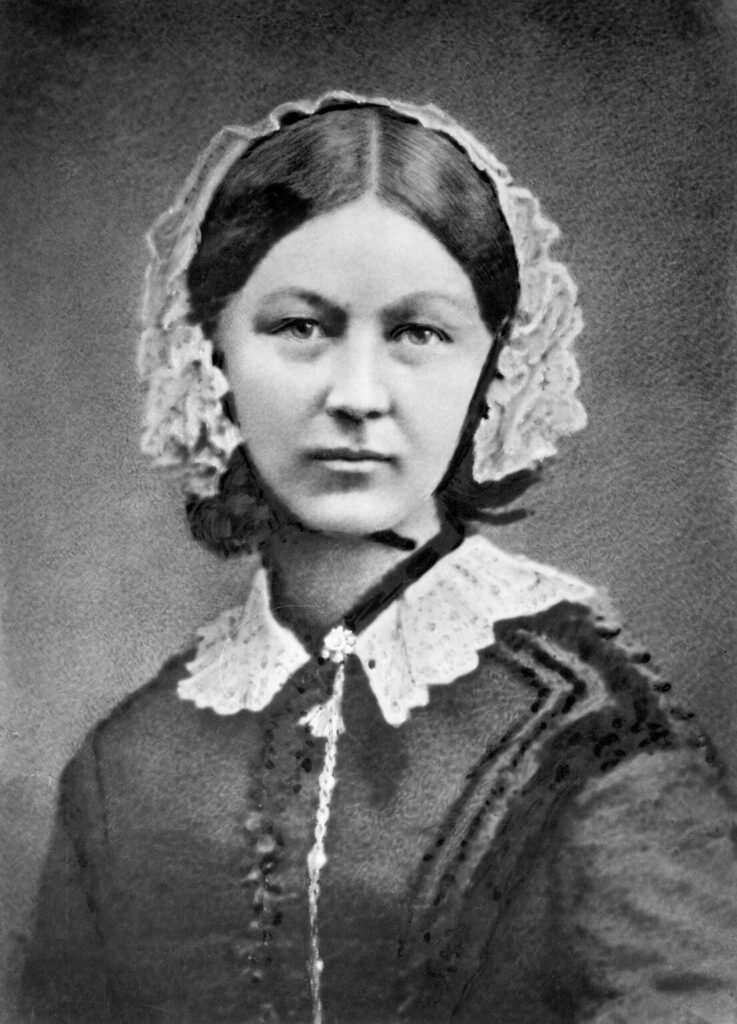
Born in 1820 in Florence, Italy, Florence Nightingale defied societal expectations to pursue her passion for nursing. Despite facing numerous obstacles, she became known as “The Lady with the Lamp” for her dedicated care of soldiers during the Crimean War, earning widespread admiration for her compassion and dedication to healing.
While Nightingale’s nursing skills were widely recognized, her approach to addressing healthcare challenges went beyond the patients’ bedside. Recognizing the dire conditions in military hospitals and the alarming mortality rates among soldiers, Nightingale turned to data analysis to understand the root causes and drive meaningful change.
Amidst the chaos of war, Nightingale devised a method of data visualization—the Rose Chart.
The Famous Florence Nightingale Rose Chart.
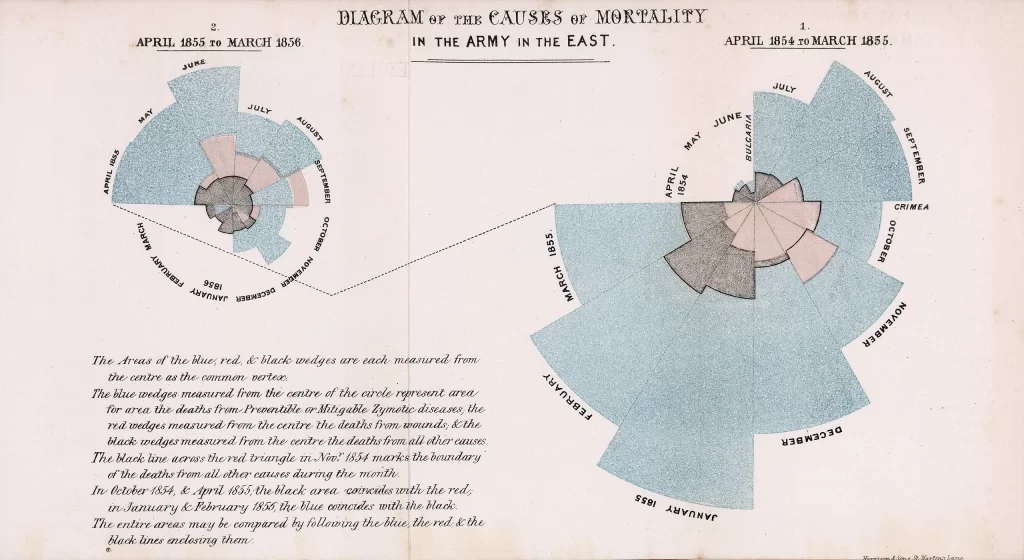
This innovative chart transformed complex statistical data into a visual representation, illustrating the leading causes of soldier mortality during the Crimean War. With each segment of the chart representing a different cause of death, Nightingale effectively communicated the urgency of sanitary reform in military hospitals to policymakers and the public.
Nightingale’s use of the Rose Chart wasn’t just about presenting numbers; it was a call to action. With visual evidence, she advocated for improvements in sanitation, nutrition, and healthcare infrastructure, ultimately revolutionizing military medicine practices and saving countless lives.
Female Inlusivity in Data Analytics.
This is a throwback to 1854, but this woman’s move still stands the test of time. During Women’s History Month, we celebrate Florence Nightingale’s legacy in both nursing and statistics. Her innovations paved the way for future generations of women in healthcare and STEM fields, inspiring us to continue advocating for gender equality in all spheres of life.
In Data Analytics, ringing the bell for gender equality is not only necessary but also essential for driving innovation and progress. Much like Florence Nightingale pioneered the use of data visualization to advance healthcare, we must champion diversity and inclusion in the data field to ensure that all voices are heard and all perspectives are considered.
Just as Nightingale’s groundbreaking work transformed healthcare practices, promoting gender equality in the data field can lead to groundbreaking insights and solutions. By embracing diverse perspectives and experiences, we can uncover biases, identify overlooked trends, and develop more inclusive and equitable strategies for leveraging data.
If you’re interested in enhancing your visualization skills to effectively communicate data insights, consider enrolling in our Data Analytics Mastery course. Whether you’re a beginner or seeking to become an advanced professional, our course will refine your abilities in this critical field.
We not only teach the technical skills needed to excel in the field but also emphasize the importance of diversity and inclusion. By creating an environment where everyone feels valued and empowered to contribute.