If you’ve used Power BI for a while, you’re probably familiar with the main views: Report view, Table view, Model view, and more recently, DAX Query view. Each of these views serves a different purpose in your data journey, from shaping and modeling your data to visualizing and analyzing it.
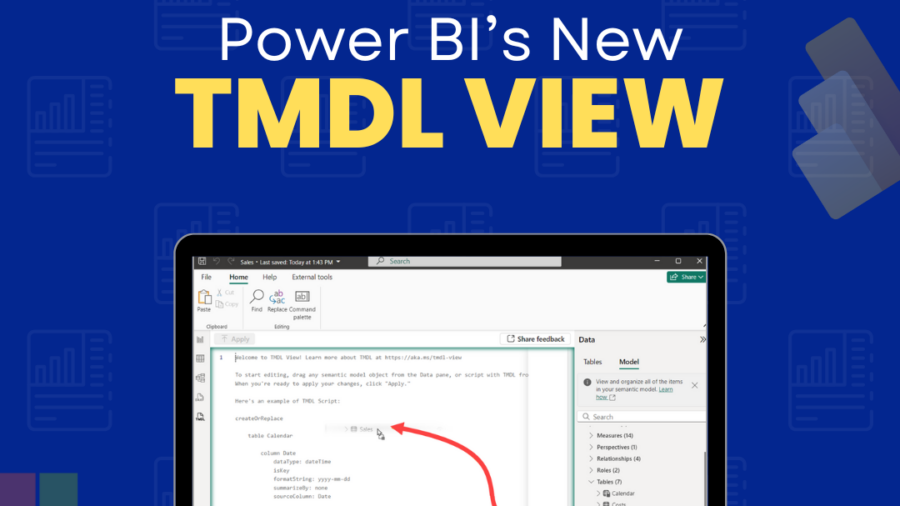
Now, Microsoft has added something new: the TMDL View. And while the name might sound technical (it stands for Tabular Model Definition Language), its purpose is straightforward: it lets you see and edit the “blueprint” of your Power BI data model in a text-based format.

Think of it like this:
Report view is the showroom. It’s where you arrange your visuals, charts, and tables so others can see your insights.
Table (Data) view is the storeroom. You can open up each table and peek at the actual data sitting inside.
Model view is the floor plan. It shows how your tables are connected and the relationships that hold your data model together.
DAX Query view is the test bench. Where you can write and run DAX formulas to explore data or troubleshoot calculations.
TMDL view is the blueprint archive. It reveals all the design details of your data model in a clean, editable text format.
Why TMDL View Matters
Before TMDL View, making certain model changes often meant clicking through multiple menus and dialog boxes. With TMDL, you can work directly with the underlying “recipe” of your model, written in YAML, a simple, human-readable text format that’s less intimidating than raw code but more precise than clicking through menus.
YAML lays out your model’s details in a structured way:
Tables and columns: their names, data types, and formatting.
Relationships: which tables are linked and how.
Measures: the DAX calculations your reports rely on.
This text-based view is especially useful for:
- Editing in bulk, e.g., quickly renaming multiple columns or measures without opening them one by one.
- Version control: Storing your model definition in a file so you can track changes over time.
- Collaboration: sharing the model definition with others who can edit it without opening Power BI Desktop.
How It Works
1. Enable TMDL View: In Power BI Desktop, go to File > Options and Settings > Options > Preview features and check TMDL View, then restart the app.
2. Open the editor: Click the new TMDL icon in the left sidebar. The editor starts empty.
3. Bring in parts of your model: Drag items like tables, columns, or measures from the Data pane into the editor. Power BI will write out that part in TMDL format, ready for editing.
4. Edit with ease:
- Smart formatting, autocomplete, and syntax highlighting make editing smooth.
- Tooltips explain what each part means when you hover over code.
- Lightbulb icons offer quick fixes or generate helpful tags automatically.
- Error diagnostics highlight and explain issues, and there’s a pane that shows all problems at once.
5. Preview and apply changes:
You can preview your edits. Power BI shows you what will change, with deletions in red and additions in green. Once you’re happy, click Apply to make it live.
How It Fits with the Other Views
While Report View is about presentation, Table View is about raw data, Model View is about structure, and DAX Query View is about logic and testing, TMDL View is about definition. It’s the only view that gives you a direct line to the underlying blueprint of your model. In other words, the other views let you see and use the model; TMDL View lets you define and edit it at its core.
If you’re a casual Power BI user, you might not live in TMDL View every day. But for anyone who’s serious about efficiency, documentation, or fine-tuning a model, this new view is a game-changer. It bridges the gap between visual modeling and behind-the-scenes configuration right inside the tool you’re already using.
Learn how to use Power BI by enrolling with Dataleum.
